OxyPlot is a cross-platform plotting library for .NET(http://www.oxyplot.org/).
有简单的文档(http://docs.oxyplot.org/en/latest/common-tasks/refresh-plot.html). 这里以OxyPlot.WPF为例.
用词
Plot:
Also called a graph or chart
Plot model:
A model represents the contents of a plot
Plot controller:
Handles user input
Plot view:
The custom control that displays the plot model and communicates with the plot controller
Plot element: An element of the plot model that can be displayed (e.g. a series, annotation or axis)
Axis:
A plot element that displays an axis
Series:
A plot element that displays data
Annotation:
Displays content that is not a series. Annotations are not included in the legend and not used by the tracker
Plot area:
The area where the series are displayed
Legend:
Displays the titles and symbol of the series.
Tracker:
When the user hovers or clicks on a series, the tracker shows the actual values at that point
OxyPlot分为OxyPlot(Portable)和OxyPlot.Wpf两部分. OxyPlot(Portable)暴露IPlotView接口, OxyPlot.Wpf中的PlotBase继承Control, 同时实现IPlotView. 其他和平台无关的类, 都位于OxyPlot(Portable)中, 例如PlotModel和IPlotModel, IPlotController和PlotController.
先看入门样例(http://docs.oxyplot.org/en/latest/getting-started/hello-wpf.html):
创建ViewModel
1 | namespace WpfApplication1 |
创建View
1 | <Window x:Class="WpfApplication1.MainWindow" |
运行得到下图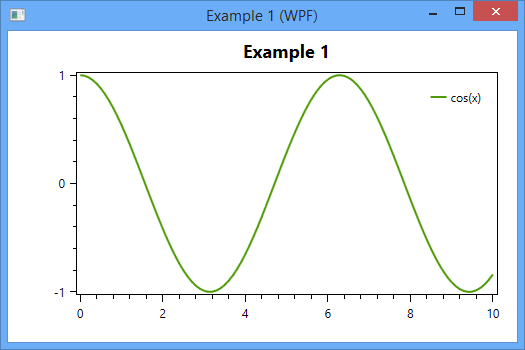
先看PlotView的部分代码1
2
3
4
5
6
7
8
9
10
11
12
13
14
15
16
17
18
19
20
21
22
23
24
25
26
27
28
29
30
31
32
33
34
35
36
37
38/// <summary>
/// Identifies the <see cref="Model"/> dependency property.
/// </summary>
public static readonly DependencyProperty ModelProperty =
DependencyProperty.Register("Model", typeof(PlotModel), typeof(PlotView), new PropertyMetadata(null, ModelChanged));
/// <summary>
/// Called when the model is changed.
/// </summary>
/// <param name="d">The sender.</param>
/// <param name="e">The <see cref="System.Windows.DependencyPropertyChangedEventArgs" /> instance containing the event data.</param>
private static void ModelChanged(DependencyObject d, DependencyPropertyChangedEventArgs e)
{
((PlotView)d).OnModelChanged();
}
/// <summary>
/// Called when the model is changed.
/// </summary>
private void OnModelChanged()
{
lock (this.modelLock)
{
if (this.currentModel != null)
{
((IPlotModel)this.currentModel).AttachPlotView(null);
this.currentModel = null;
}
if (this.Model != null)
{
((IPlotModel)this.Model).AttachPlotView(this);
this.currentModel = this.Model;
}
}
this.InvalidatePlot();
}
当面Model的值发生变化时, 会调用ModelChanged方法, 进而调用this.InvalidatePlot方法绘图. 这里另外一个地方也很重要: AttachPlotView(this). 将PlotView关联到PlotModel中.
InvalidatePlot方法是在父类PlotBase中定义的, 这个方法至关重要.1
2
3
4
5
6
7
8
9
10
11
12
13
14
15
16
17
18
19
20
21
22
23
24
25
26
27
28
29
30
31
32
33/// <summary>
/// Invalidate the PlotView (not blocking the UI thread)
/// </summary>
/// <param name="updateData">The update Data.</param>
public void InvalidatePlot(bool updateData = true)
{
if (this.ActualWidth <= 0 || this.ActualHeight <= 0)
{
return;
}
this.UpdateModel(updateData);
if (Interlocked.CompareExchange(ref this.isPlotInvalidated, 1, 0) == 0)
{
// Invalidate the arrange state for the element.
// After the invalidation, the element will have its layout updated,
// which will occur asynchronously unless subsequently forced by UpdateLayout.
this.BeginInvoke(this.InvalidateArrange);
}
}
/// <summary>
/// Updates the model.
/// </summary>
/// <param name="updateData">The update Data.</param>
protected virtual void UpdateModel(bool updateData = true)
{
if (this.ActualModel != null)
{
((IPlotModel)this.ActualModel).Update(updateData);
}
}
第一步更新PlotModel, 第二步异步调用InvalidateArrange进行绘制. InvalidateArrange是Control的方法, 最终调用的ArrangeOverride方法1
2
3
4
5
6
7
8
9
10
11
12
13
14
15
16
17
18
19
20
21
22
23
24
25
26
27
28
29
30
31
32
33
34
35
36
37
38
39
40
41
42
43
44
45
46
47
48
49
50
51
52
53
54
55
56
57
58
59
60
61
62
63
64
65
66
67
68
69
70/// <summary>
/// Provides the behavior for the Arrange pass of Silverlight layout. Classes can override this method to define their own Arrange pass behavior.
/// </summary>
/// <param name="finalSize">The final area within the parent that this object should use to arrange itself and its children.</param>
/// <returns>The actual size that is used after the element is arranged in layout.</returns>
protected override Size ArrangeOverride(Size finalSize)
{
if (this.ActualWidth > 0 && this.ActualHeight > 0)
{
if (Interlocked.CompareExchange(ref this.isPlotInvalidated, 0, 1) == 1)
{
this.UpdateVisuals();
}
}
return base.ArrangeOverride(finalSize);
}
/// <summary>
/// Updates the visuals.
/// </summary>
private void UpdateVisuals()
{
if (this.canvas == null || this.renderContext == null)
{
return;
}
if (!this.isVisibleToUserCache)
{
return;
}
// Clear the canvas
this.canvas.Children.Clear();
if (this.ActualModel != null && this.ActualModel.Background.IsVisible())
{
this.canvas.Background = this.ActualModel.Background.ToBrush();
}
else
{
this.canvas.Background = null;
}
if (this.ActualModel != null)
{
if (this.DisconnectCanvasWhileUpdating)
{
// TODO: profile... not sure if this makes any difference
int idx = this.grid.Children.IndexOf(this.canvas);
if (idx != -1)
{
this.grid.Children.RemoveAt(idx);
}
((IPlotModel)this.ActualModel).Render(this.renderContext, this.canvas.ActualWidth, this.canvas.ActualHeight);
// reinsert the canvas again
if (idx != -1)
{
this.grid.Children.Insert(idx, this.canvas);
}
}
else
{
((IPlotModel)this.ActualModel).Render(this.renderContext, this.canvas.ActualWidth, this.canvas.ActualHeight);
}
}
}
在UpdateVisual方法中, 看到了Render方法. 该方法是在PlotModel中定义的. 也就是说PlotView不关心具体的绘制逻辑, 它只提供绘图的纸和笔(RenderContext, 在WPF中,该RenderContext就是Canvas). 然后由PlotModel负责整个绘制逻辑. PlotModel由各种PlotElement组成, 各种PlotElement有自己的绘图逻辑. 于是PlotModel把从PlotView中拿到的纸和笔, 再交给具体的PlotElement, 由他们自己去绘制.
1 | /// <summary> |